Data is collected, shared, hacked, bought, and sold every day. So, what is it, and why is it so important? According to the Cambridge Dictionary, data is defined as information—especially facts or numbers—collected to be examined and considered, or used to help in decision-making. It can also refer to information in an electronic form that can be stored and used by a computer.
But why do we often think of numbers when we think of data? The truth is, it can include much more—notes, articles, videos, photos, audio files, and everything in between. The type of data we focus on depends on the question we’re trying to answer.
Understanding Different Types of Data
The type of data that matters most can vary depending on your role in the financial industry. Here are some examples of how brokers, payment providers, and liquidity providers focus on specific metrics to achieve their goals.
Data in Brokerage Firms
For example, if you’re a broker, you’d focus on data such as the number of trades executed by clients, the total trading volume across different asset classes like forex, commodities, and cryptocurrencies, and the times of day with the highest activity to better understand client behavior and optimize platform performance.

An example of this is seen above in our FX/CFD Heat Map from the previous Quarterly Intelligence Report, which provides a visual representation of market engagement across different regions. Such insights help brokers customize their strategies to better align with the specific needs and behaviors of their global clients.
Data in Payment Providers
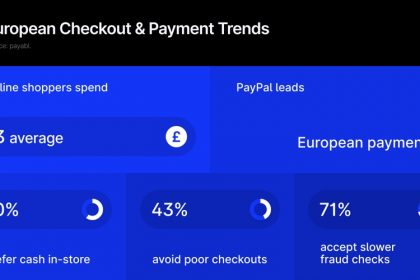
On the other hand, if you’re a payment provider, you’d focus on data such as the number of transactions processed through different payment methods like credit cards, debit cards, and digital wallets, as well as the average transaction value for each method to understand customer preferences and spending behavior.

An example of this is shown above in our chart from the previous Quarterly Intelligence Report, which illustrates the global e-commerce payment landscape from 2023 to 2027. This visual representation highlights the continued rise of digital wallets and the evolving shares of other payment methods. Such data enables payment providers to fine-tune their services to meet the shifting demands of consumers across different markets, enhancing their strategic positioning.
Data in Liquidity Providers
If you’re a liquidity provider, you’d focus on data such as the bid-ask spread across various financial instruments, the volume of orders coming from different brokers, as well as the latency of order execution to ensure you can provide competitive spreads and fast execution for your clients.

This example table from our previous Quarterly Intelligence Report illustrates the monthly trading volumes across major brokers. Such data is vital for liquidity providers to assess market trends and refine their strategies.
Categorizing Data: Quantitative vs. Qualitative
-
Quantitative Data: This is all about numbers—it’s what we count, measure, and compare on a numerical scale. Examples include survey ratings or the number of attendees at an event like the Finance Magnates London Summit.
-
Qualitative Data: This includes information that’s not about numbers—like maps, content, pictures, and infographics, often analyzed and interpreted by qualitative researchers.
Of course, there are other ways to categorize data, but most types fall into these two main categories. And it’s important not to confuse data with statistics. Statistics are the results we get when we interpret and analyze metrics.
Data is a powerful tool for understanding our business, and it’s all around us. Companies are investing heavily in data science to help them make smarter decisions, predict trends, and stay one step ahead in a very competitive industry. But even with all this intelligence, many businesses still struggle with one important thing: turning those insights into clear insights that decision-makers can actually use.
The Problem: Communication
Data science can achieve amazing things, like finding patterns in massive amounts of information. However, there’s a big challenge that many companies face—they struggle to communicate what the insights mean in a way that’s easy to understand. This issue, often referred to as the “last mile,” occurs when findings need to be explained clearly to the people who make decisions.

Sylwester Majewski, Head of Business Intelligence at Finance Magnates
“The big issue we are all facing is the growing amount of information. We live in a time when we have relatively easy access to any information we need, thanks to the internet. However, people are not able to digest everything and often feel lost in the ocean of information and data. Unfortunately, with the rise of artificial intelligence, this will only get worse. The amount of content created by AI is rising enormously, yet the quality of this content is decreasing. In most cases, AI is simply recycling already existing information,” shared Sylwester Majewski, Head of Business Intelligence at Finance Magnates.
“More and more people are noticing this, as we are flooded with AI-generated content,” he continued. “This makes people increasingly seek out reliable sources of information and unique, tailored reports. I believe—and we can already see it—that both our Quarterly Intelligence and Custom Reports are becoming even more sought after than in the past. Intelligence is able to cut through the noise and deliver quality content to our customers. I believe the role of Intelligence will be to find golden nuggets in the ocean of data and fake content and to present them to our customers in a way that best serves their needs.”
Too often, data is presented in a way that’s too technical or complicated, leaving executives confused or unsure about what actions to take. This is a common problem, even in companies with strong data analytics teams and the best tools available.
For example: A broker identifies inefficiencies in their trading platform through data analysis. However, the findings are communicated using complex models and technical terms, leaving decision-makers confused.


Izmini Nicolaou, Business Intelligence Data Analyst
“As a Business Intelligence Data Analyst, the primary challenge I face is ensuring the integrity and consistency of data from diverse sources. Data cleaning and integration are foundational, as the insights drawn from inaccurate data can lead to poor decision-making,” explained Izmini Nicolaou.
“Another issue is managing the sheer volume of data,” she continued. “Efficiently processing and analyzing large datasets is critical to distill actionable insights and avoid information overload. Leveraging advanced data management tools and analytical techniques is essential for this.”
“Additionally, translating complex data findings into understandable, actionable insights for non-technical stakeholders is crucial,” she highlighted. “This often involves creating intuitive visualizations and dashboards that clearly communicate key outcomes.”
“Keeping pace with the fast-evolving landscape of business needs and technology also demands continuous learning and adaptation,” she added. “It is essential to stay updated with the latest tools and trends in data analytics to remain effective in my role.”
Bridging the Gap
To address this challenge, companies need more than just skilled data scientists—they need teams that can communicate effectively. This involves bringing together different types of experts: data analysts, business experts, designers, and storytellers. When these diverse skills collaborate, they ensure that the insights are not only accurate but also clear and actionable.

Andrei Alekseev, CMO at Financial Broker
“In my opinion, this is critically important and not only for marketing efforts,” said Andrei Alekseev, CMO at Financial Broker. “In our work, we interact quite closely with the Sales and Customer Support departments. As marketers, we often experiment with traffic sources and collect large amounts of data at the first stages of the funnel. Then we segment the database of users and pass them on to the Sales department for further processing and upselling. After a while, we already see complete data on each of the customer segments and can make balanced business decisions on further tactics.”
For example, telling a story with data can make it more relatable and easier to understand. Effective data visualization—using clear charts and graphs—can help by breaking down complex information into something simple and straightforward.
Imagine a scenario where a data team works closely with marketing and design experts to present a set of trading insights. Instead of relying solely on technical charts, they create a narrative that highlights key trends and uses simple, intuitive visuals. This approach not only makes it easier to understand but also helps decision-makers quickly see the implications and take action.
Looking Ahead
As data continues to shape the financial industry, staying informed about the latest trends and developments is crucial. In our upcoming intelligence reports, we’ll explore the impact of AI on KYC and AML services, offering insights into how these technologies are enhancing efficiency and compliance in the CFD industry. We’ll also take a closer look at the new Markets in Crypto Assets Regulation (MiCA) and what it means for brokers offering cryptocurrency trading.
You’ll find expert perspectives on whether AI can revolutionize the marketing of CFD products, alongside the latest broker rankings based on trading volumes. We’ll highlight key industry milestones, including brokers achieving over $1 trillion in average monthly volume and the growing popularity of MT5.
In a world where data is abundant but clarity is rare, having the right information at your fingertips can make all the difference. Stay connected, and let us guide you through the complexities of today’s financial markets.
Data is collected, shared, hacked, bought, and sold every day. So, what is it, and why is it so important? According to the Cambridge Dictionary, data is defined as information—especially facts or numbers—collected to be examined and considered, or used to help in decision-making. It can also refer to information in an electronic form that can be stored and used by a computer.
But why do we often think of numbers when we think of data? The truth is, it can include much more—notes, articles, videos, photos, audio files, and everything in between. The type of data we focus on depends on the question we’re trying to answer.
Understanding Different Types of Data
The type of data that matters most can vary depending on your role in the financial industry. Here are some examples of how brokers, payment providers, and liquidity providers focus on specific metrics to achieve their goals.
Data in Brokerage Firms
For example, if you’re a broker, you’d focus on data such as the number of trades executed by clients, the total trading volume across different asset classes like forex, commodities, and cryptocurrencies, and the times of day with the highest activity to better understand client behavior and optimize platform performance.
An example of this is seen above in our FX/CFD Heat Map from the previous Quarterly Intelligence Report, which provides a visual representation of market engagement across different regions. Such insights help brokers customize their strategies to better align with the specific needs and behaviors of their global clients.
Data in Payment Providers
On the other hand, if you’re a payment provider, you’d focus on data such as the number of transactions processed through different payment methods like credit cards, debit cards, and digital wallets, as well as the average transaction value for each method to understand customer preferences and spending behavior.
An example of this is shown above in our chart from the previous Quarterly Intelligence Report, which illustrates the global e-commerce payment landscape from 2023 to 2027. This visual representation highlights the continued rise of digital wallets and the evolving shares of other payment methods. Such data enables payment providers to fine-tune their services to meet the shifting demands of consumers across different markets, enhancing their strategic positioning.
Data in Liquidity Providers
If you’re a liquidity provider, you’d focus on data such as the bid-ask spread across various financial instruments, the volume of orders coming from different brokers, as well as the latency of order execution to ensure you can provide competitive spreads and fast execution for your clients.
This example table from our previous Quarterly Intelligence Report illustrates the monthly trading volumes across major brokers. Such data is vital for liquidity providers to assess market trends and refine their strategies.
Categorizing Data: Quantitative vs. Qualitative
-
Quantitative Data: This is all about numbers—it’s what we count, measure, and compare on a numerical scale. Examples include survey ratings or the number of attendees at an event like the Finance Magnates London Summit.
-
Qualitative Data: This includes information that’s not about numbers—like maps, content, pictures, and infographics, often analyzed and interpreted by qualitative researchers.
Of course, there are other ways to categorize data, but most types fall into these two main categories. And it’s important not to confuse data with statistics. Statistics are the results we get when we interpret and analyze metrics.
Data is a powerful tool for understanding our business, and it’s all around us. Companies are investing heavily in data science to help them make smarter decisions, predict trends, and stay one step ahead in a very competitive industry. But even with all this intelligence, many businesses still struggle with one important thing: turning those insights into clear insights that decision-makers can actually use.
The Problem: Communication
Data science can achieve amazing things, like finding patterns in massive amounts of information. However, there’s a big challenge that many companies face—they struggle to communicate what the insights mean in a way that’s easy to understand. This issue, often referred to as the “last mile,” occurs when findings need to be explained clearly to the people who make decisions.
Sylwester Majewski, Head of Business Intelligence at Finance Magnates
“The big issue we are all facing is the growing amount of information. We live in a time when we have relatively easy access to any information we need, thanks to the internet. However, people are not able to digest everything and often feel lost in the ocean of information and data. Unfortunately, with the rise of artificial intelligence, this will only get worse. The amount of content created by AI is rising enormously, yet the quality of this content is decreasing. In most cases, AI is simply recycling already existing information,” shared Sylwester Majewski, Head of Business Intelligence at Finance Magnates.
“More and more people are noticing this, as we are flooded with AI-generated content,” he continued. “This makes people increasingly seek out reliable sources of information and unique, tailored reports. I believe—and we can already see it—that both our Quarterly Intelligence and Custom Reports are becoming even more sought after than in the past. Intelligence is able to cut through the noise and deliver quality content to our customers. I believe the role of Intelligence will be to find golden nuggets in the ocean of data and fake content and to present them to our customers in a way that best serves their needs.”
Too often, data is presented in a way that’s too technical or complicated, leaving executives confused or unsure about what actions to take. This is a common problem, even in companies with strong data analytics teams and the best tools available.
For example: A broker identifies inefficiencies in their trading platform through data analysis. However, the findings are communicated using complex models and technical terms, leaving decision-makers confused.
Izmini Nicolaou, Business Intelligence Data Analyst
“As a Business Intelligence Data Analyst, the primary challenge I face is ensuring the integrity and consistency of data from diverse sources. Data cleaning and integration are foundational, as the insights drawn from inaccurate data can lead to poor decision-making,” explained Izmini Nicolaou.
“Another issue is managing the sheer volume of data,” she continued. “Efficiently processing and analyzing large datasets is critical to distill actionable insights and avoid information overload. Leveraging advanced data management tools and analytical techniques is essential for this.”
“Additionally, translating complex data findings into understandable, actionable insights for non-technical stakeholders is crucial,” she highlighted. “This often involves creating intuitive visualizations and dashboards that clearly communicate key outcomes.”
“Keeping pace with the fast-evolving landscape of business needs and technology also demands continuous learning and adaptation,” she added. “It is essential to stay updated with the latest tools and trends in data analytics to remain effective in my role.”
Bridging the Gap
To address this challenge, companies need more than just skilled data scientists—they need teams that can communicate effectively. This involves bringing together different types of experts: data analysts, business experts, designers, and storytellers. When these diverse skills collaborate, they ensure that the insights are not only accurate but also clear and actionable.
Andrei Alekseev, CMO at Financial Broker
“In my opinion, this is critically important and not only for marketing efforts,” said Andrei Alekseev, CMO at Financial Broker. “In our work, we interact quite closely with the Sales and Customer Support departments. As marketers, we often experiment with traffic sources and collect large amounts of data at the first stages of the funnel. Then we segment the database of users and pass them on to the Sales department for further processing and upselling. After a while, we already see complete data on each of the customer segments and can make balanced business decisions on further tactics.”
For example, telling a story with data can make it more relatable and easier to understand. Effective data visualization—using clear charts and graphs—can help by breaking down complex information into something simple and straightforward.
Imagine a scenario where a data team works closely with marketing and design experts to present a set of trading insights. Instead of relying solely on technical charts, they create a narrative that highlights key trends and uses simple, intuitive visuals. This approach not only makes it easier to understand but also helps decision-makers quickly see the implications and take action.
Looking Ahead
As data continues to shape the financial industry, staying informed about the latest trends and developments is crucial. In our upcoming intelligence reports, we’ll explore the impact of AI on KYC and AML services, offering insights into how these technologies are enhancing efficiency and compliance in the CFD industry. We’ll also take a closer look at the new Markets in Crypto Assets Regulation (MiCA) and what it means for brokers offering cryptocurrency trading.
You’ll find expert perspectives on whether AI can revolutionize the marketing of CFD products, alongside the latest broker rankings based on trading volumes. We’ll highlight key industry milestones, including brokers achieving over $1 trillion in average monthly volume and the growing popularity of MT5.
In a world where data is abundant but clarity is rare, having the right information at your fingertips can make all the difference. Stay connected, and let us guide you through the complexities of today’s financial markets.